Anatomical partitioning
Extract 512 × 512 patches at 20× magnification. Frozen segmentation models separate them into glomerular-enriched and non-glomerular bags.
Anatomy-Aware Dual-Stream Multiple Instance Learning
for Kidney Function Prediction
University of British Columbia · Vancouver, Canada
AC-MIL is an anatomy-aware dual-stream multiple instance learning framework for predicting estimated glomerular filtration rate (eGFR) from kidney whole-slide images. It represents each slide as two bags of patches: glomerular-enriched and non-glomerular. This separation preserves compartment-specific information that may be diluted when all tissue is pooled into a single representation.
A shared frozen CONCHv1.5 encoder embeds both bags. Each stream is pooled independently, and a bidirectional gating module integrates the resulting representations. Both pooled embeddings condition each gate, allowing the model to modulate features from either compartment using the context of the whole slide.
Extract 512 × 512 patches at 20× magnification. Frozen segmentation models separate them into glomerular-enriched and non-glomerular bags.
A shared frozen encoder embeds both bags. Mean pooling, ABMIL, or TransMIL produces one pooled representation per compartment.
Both pooled representations condition two feature-wise gates. The gated embeddings are concatenated and passed to a regression head to predict eGFR.
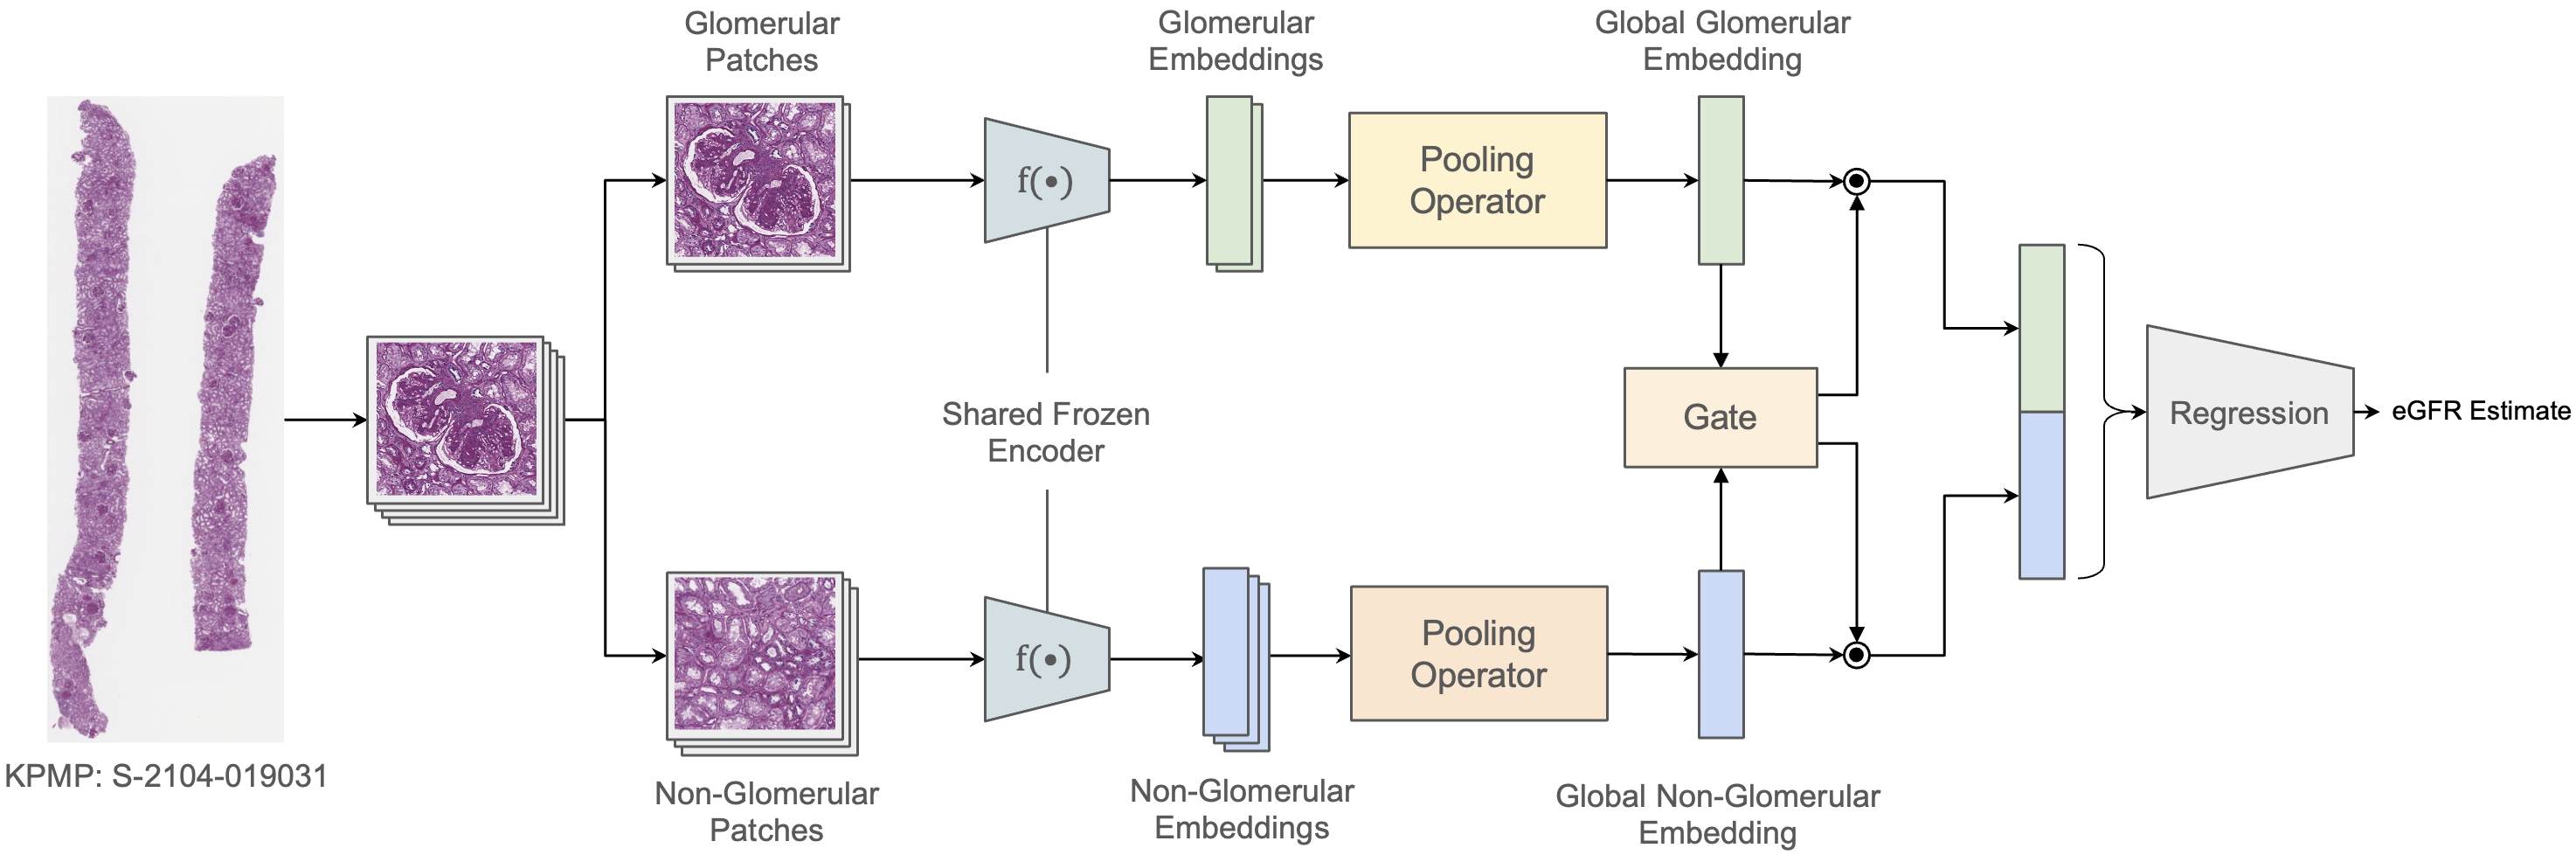
ABMIL with bidirectional gating. Performance is evaluated by patient-level cross-validation; the complete comparisons and reported variation are presented below.
Main results
AC-MIL with ABMIL achieves the highest Pearson and Spearman correlations and the lowest RMSE among the 21 evaluated configurations. The comparison includes whole-slide pooling, compartment-specific models, late fusion, and unidirectional gating.
| Input / integration | Pearson r ↑ | Spearman ρ ↑ | RMSE ↓ |
|---|---|---|---|
| Whole slidesingle-stream | 0.5214 ± 0.0400 | 0.4850 ± 0.0434 | 21.90 ± 3.0088 |
| Glomerular-enrichedsingle-stream | 0.4380 ± 0.0729 | 0.4001 ± 0.0780 | 23.30 ± 3.5793 |
| Non-glomerularsingle-stream | 0.5478 ± 0.0579 | 0.5165 ± 0.0504 | 21.70 ± 3.1528 |
| Late fusiondual-stream | 0.4938 ± 0.0088 | 0.4767 ± 0.0115 | 23.65 ± 2.8058 |
| Glomerular gatedual-stream | 0.4978 ± 0.0280 | 0.4521 ± 0.0452 | 22.31 ± 2.6821 |
| Non-glomerular gatedual-stream | 0.4716 ± 0.0421 | 0.4493 ± 0.0525 | 22.88 ± 2.6494 |
| AC-MILBidirectional gate · dual stream | 0.6236 ± 0.0506 | 0.5497 ± 0.0748 | 19.07 ± 3.3059 |
Three-fold patient-level cross-validation across three seeds. Values reproduce the manuscript’s reported means and ± terms; bold marks the best value in each column. Slides from the same patient remain in the same fold.
AC-MIL reduces RMSE from 21.70 to 19.07 relative to non-glomerular ABMIL, a 12.1% reduction. Relative to whole-slide ABMIL, RMSE decreases by 12.9% (21.90 to 19.07), while Pearson r increases from 0.5214 to 0.6236.
| Input / integration | Representation | Pooling | Pearson r ↑ | Spearman ρ ↑ | RMSE ↓ |
|---|---|---|---|---|---|
| Bidirectional gate | Dual-Stream | TransMIL | 0.5048 ± 0.0235 | 0.4684 ± 0.0413 | 22.53 ± 3.4903 |
| AC-MIL | Dual-Stream | ABMIL | 0.6236 ± 0.0506 | 0.5497 ± 0.0748 | 19.07 ± 3.3059 |
| Bidirectional gate | Dual-Stream | Mean Pool | 0.5248 ± 0.0477 | 0.4893 ± 0.0793 | 22.14 ± 2.8999 |
| Glomerular gate | Dual-Stream | TransMIL | 0.4612 ± 0.0410 | 0.4165 ± 0.0378 | 23.24 ± 3.6077 |
| Glomerular gate | Dual-Stream | ABMIL | 0.4978 ± 0.0280 | 0.4521 ± 0.0452 | 22.31 ± 2.6821 |
| Glomerular gate | Dual-Stream | Mean Pool | 0.5083 ± 0.1149 | 0.4839 ± 0.0975 | 22.30 ± 4.3130 |
| Non-glomerular gate | Dual-Stream | TransMIL | 0.4964 ± 0.0187 | 0.4815 ± 0.0328 | 23.28 ± 2.2006 |
| Non-glomerular gate | Dual-Stream | ABMIL | 0.4716 ± 0.0421 | 0.4493 ± 0.0525 | 22.88 ± 2.6494 |
| Non-glomerular gate | Dual-Stream | Mean Pool | 0.4624 ± 0.0281 | 0.4174 ± 0.0430 | 22.97 ± 2.5062 |
| Late fusion | Dual-Stream | TransMIL | 0.4939 ± 0.0271 | 0.4498 ± 0.0663 | 22.99 ± 3.0887 |
| Late fusion | Dual-Stream | ABMIL | 0.4938 ± 0.0088 | 0.4767 ± 0.0115 | 23.65 ± 2.8058 |
| Late fusion | Dual-Stream | Mean Pool | 0.4669 ± 0.0682 | 0.4321 ± 0.0841 | 22.58 ± 3.3420 |
| Whole slide | Single-Stream | TransMIL | 0.4734 ± 0.0073 | 0.4311 ± 0.0108 | 23.81 ± 2.3466 |
| Whole slide | Single-Stream | ABMIL | 0.5214 ± 0.0400 | 0.4850 ± 0.0434 | 21.90 ± 3.0088 |
| Whole slide | Single-Stream | Mean Pool | 0.4993 ± 0.0625 | 0.4671 ± 0.0781 | 22.47 ± 3.4559 |
| Glomerular-enriched | Single-Stream | TransMIL | 0.4805 ± 0.0585 | 0.4337 ± 0.0566 | 22.50 ± 4.1410 |
| Glomerular-enriched | Single-Stream | ABMIL | 0.4380 ± 0.0729 | 0.4001 ± 0.0780 | 23.30 ± 3.5793 |
| Glomerular-enriched | Single-Stream | Mean Pool | 0.4874 ± 0.0143 | 0.4528 ± 0.0395 | 22.45 ± 2.8337 |
| Non-glomerular | Single-Stream | TransMIL | 0.5031 ± 0.0456 | 0.4729 ± 0.0518 | 22.51 ± 3.0477 |
| Non-glomerular | Single-Stream | ABMIL | 0.5478 ± 0.0579 | 0.5165 ± 0.0504 | 21.70 ± 3.1528 |
| Non-glomerular | Single-Stream | Mean Pool | 0.4802 ± 0.0946 | 0.4579 ± 0.0944 | 22.63 ± 4.1248 |
The comparison includes TransMIL, ABMIL, and mean pooling. AC-MIL with ABMIL has the highest Pearson and Spearman correlations and the lowest RMSE.
Disease-specific experiments
The best-performing single-stream compartment differs between disease groups: glomerular-enriched tissue in diabetic kidney disease, and non-glomerular tissue in acute tubular injury and acute interstitial nephritis. AC-MIL achieves the highest Pearson correlation in both groups.
Glomerulus-involved
Among single-stream models, glomerular-enriched tissue gives the highest Pearson correlation and lowest RMSE.
| Input | Pearson r ↑ | RMSE ↓ |
|---|---|---|
| Whole slide | 0.4585 | 22.74 |
| Glomerular-enriched | 0.5689 | 20.84 |
| Non-glomerular | 0.3501 | 22.99 |
| AC-MIL | 0.5945 | 21.21 |
AC-MIL achieves Pearson r = 0.5945, compared with 0.4585 for whole-slide ABMIL. The glomerular-only model has the lowest RMSE.
Extra-glomerular
Among single-stream models for acute tubular injury and acute interstitial nephritis, non-glomerular tissue gives the highest Pearson correlation and lowest RMSE.
| Input | Pearson r ↑ | RMSE ↓ |
|---|---|---|
| Whole slide | 0.5250 | 20.88 |
| Glomerular-enriched | 0.3518 | 23.07 |
| Non-glomerular | 0.6019 | 19.35 |
| AC-MIL | 0.6366 | 19.75 |
AC-MIL achieves Pearson r = 0.6366, compared with 0.5250 for whole-slide ABMIL. The non-glomerular-only model has the lowest RMSE.
All comparisons use ABMIL. Bold denotes the highest correlation or lowest RMSE within each group. Compartment-only models achieve the lowest subgroup RMSE; AC-MIL has the highest correlation and second-lowest RMSE in both.
All three anatomy-aware inputs reduce RMSE relative to whole-slide ABMIL at each tested fixed bag size. Non-glomerular input has the largest reduction at 16 and 32 patches; AC-MIL has the largest reduction at 64 patches.
| Input | K = 16 | K = 32 | K = 64 | Natural bags |
|---|---|---|---|---|
| AC-MIL | −0.4509 | −0.5772 | −0.5299 | −2.83 |
| Glomerular | −0.7073 | −0.3259 | −0.4075 | +1.40 |
| Non-glomerular | −0.7916 | −0.6594 | −0.5041 | −0.20 |
Signed ΔRMSE relative to whole-slide ABMIL; more negative is better. Fixed-cardinality experiments use five seeds, with the same total patch budget and an even split across AC-MIL’s two streams. Non-glomerular input leads at K = 16 and K = 32; AC-MIL leads at K = 64.
Transferability
Slide embeddings learned for eGFR prediction are frozen and used to train an MLP for proteinuria or albuminuria classification. These experiments assess whether the learned representations support related renal endpoints.
AC-MIL has the highest accuracy, AUROC, and F1 among the evaluated representations. AUROC is 0.0795 higher than with whole-slide embeddings.
AC-MIL has the highest AUROC and accuracy among the evaluated representations. AUROC is 0.0879 higher than with whole-slide embeddings.
| Slide representation | Accuracy ↑ | AUROC ↑ | F1 ↑ |
|---|---|---|---|
| Whole slide | 0.6980 ± 0.0409 | 0.7465 ± 0.0771 | 0.7874 ± 0.0345 |
| Glomerular | 0.6984 ± 0.0489 | 0.7217 ± 0.0881 | 0.7822 ± 0.0425 |
| Non-glomerular | 0.7390 ± 0.0477 | 0.8087 ± 0.1232 | 0.8102 ± 0.0354 |
| AC-MIL | 0.7438 ± 0.0093 | 0.8260 ± 0.1074 | 0.8160 ± 0.0025 |
| Slide representation | Accuracy ↑ | AUROC ↑ | F1 ↑ |
|---|---|---|---|
| Whole slide | 0.6650 ± 0.0109 | 0.6363 ± 0.1562 | 0.7668 ± 0.0176 |
| Glomerular | 0.6656 ± 0.0487 | 0.7124 ± 0.0949 | 0.7601 ± 0.0169 |
| Non-glomerular | 0.6499 ± 0.0378 | 0.6465 ± 0.1846 | 0.7470 ± 0.0111 |
| AC-MIL | 0.6687 ± 0.0387 | 0.7242 ± 0.0748 | 0.7648 ± 0.0345 |
All single-stream representations use ABMIL; AC-MIL uses bidirectional gating. The eGFR-trained slide embeddings are frozen, and downstream MLP classifiers are trained for each target. Bold marks the best value per target and metric. This evaluates transfer between tasks; external-cohort generalization is not evaluated here.
Among single-stream representations, non-glomerular embeddings have the highest proteinuria AUROC, while glomerular embeddings have the highest albuminuria AUROC. AC-MIL has the highest AUROC and accuracy for both targets. Whole-slide embeddings have a slightly higher albuminuria F1 (0.7668 versus 0.7648).
Pathology analysis
High-attention patches from each stream are examined using a vision-language model, comparing patients with high and low predicted eGFR.
The low-predicted-eGFR group has higher frequencies of VLM-identified inflammation, fibrosis or matrix expansion, injury, and structural distortion. VLM-identified inflammation is reported in 14.0% of patches in this group, compared with 4.2% in the high-predicted-eGFR group.
VLM-identified injury or degeneration is more frequent in the high-predicted-eGFR group than in the low-predicted-eGFR group (9.9% versus 2.3%). The observed association differs from that in glomerular patches.
| Feature | Glomerular patches | Non-glomerular patches | ||
|---|---|---|---|---|
| High predicted eGFR | Low predicted eGFR | High predicted eGFR | Low predicted eGFR | |
| Inflammation | 4.2 ± 0.9 | 14.0 ± 1.9 | 5.1 ± 3.0 | 3.4 ± 5.2 |
| Fibrosis or matrix expansion | 1.3 ± 2.4 | 6.9 ± 0.7 | 3.4 ± 5.9 | 2.8 ± 0.7 |
| Injury or degenerative change | 1.8 ± 3.1 | 6.0 ± 1.0 | 9.9 ± 1.1 | 2.3 ± 1.6 |
| Structural distortion | 2.5 ± 0.3 | 5.6 ± 1.7 | 0.9 ± 2.2 | 0.1 ± 1.0 |
High and low refer to model-predicted eGFR. Quilt-LLaVA characterizes high-attention patches, and a separate language model aggregates the outputs. The reported uncertainty uses patch-level bootstrapping. Colored values mark the differences highlighted in the manuscript.
The VLM-based summaries identify different morphologic patterns across the two streams. These exploratory findings require validation by expert renal pathologists.
AC-MIL is presented in Context Matters: Anatomy-Aware Dual-Stream Multiple Instance Learning Framework for eGFR Prediction.
@inproceedings{arab2026context,
  title     = {Context Matters: Anatomy-Aware Dual-Stream Multiple Instance Learning Framework for e{GFR} Prediction},
  author    = {Abteen Arab and Maziar Riazy and Ali Bashashati},
  booktitle = {Medical Imaging with Deep Learning - Short Papers},
  year      = {2026},
  url       = {https://openreview.net/forum?id=KTfPFMntqQ}
}